_main
Variables can be accessed either as part of a dataset, by their dtype, or individually.
# To access the entire dataset:
ix.eda(titanic)

# Alternatively, to access specific variables by their dtype:
ix.eda(titanic, val='categorical')

# Alternatively, to access the 'Pclass' variable individually:
ix.eda(titanic, 'Pclass')

Statistical Information on the Variable
| VALID | Percentage of valid observations in the variable |
| MISSING | Percentage of missing observations in the variable |
| UNIQUE | Percentage of unique observations in the variable |
The mini bar chart shows the variable value distribution (it uses log-scale making variations more apparent)
Stats
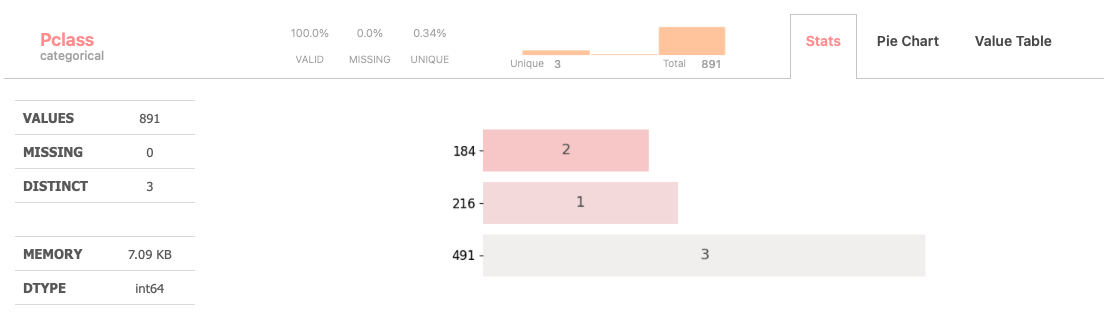
The “Stats” tab provides users with standart categorical set of statistics
Additionally, the tab includes a vertical barchart, providing a comprehensive visualization of the variable’s distribution.
| VALUES | Number of valid values in the variable |
| MISSING | Number of missing observations in the variable |
| DISTINCT | Number of unique observations in the variable |
| MEMORY | Memory size of the variable |
| DTYPE | Pandas datatype |
Pie Chart
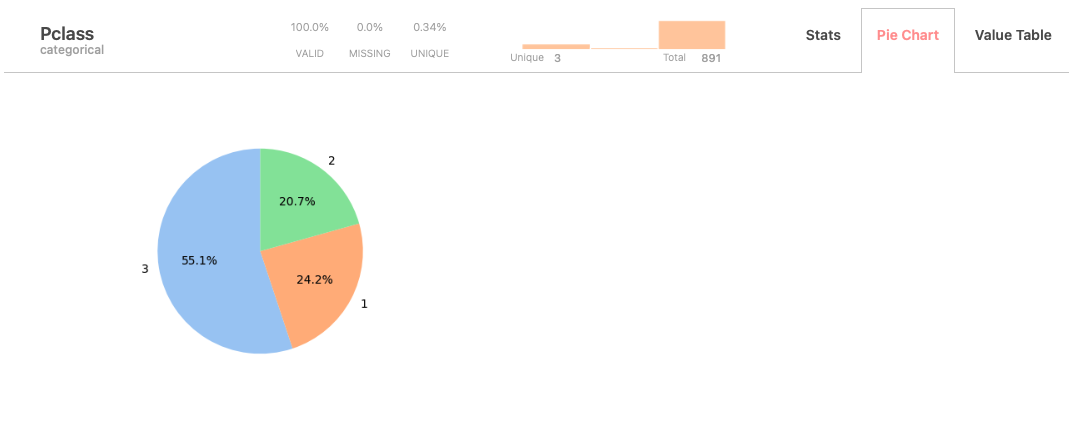
The tab includes a pie chart, which offers a visual representation of the distribution of values for the variable. It depicts the proportion of each category relative to the total variable, enabling a quick assessment of the distribution pattern.
Value Table
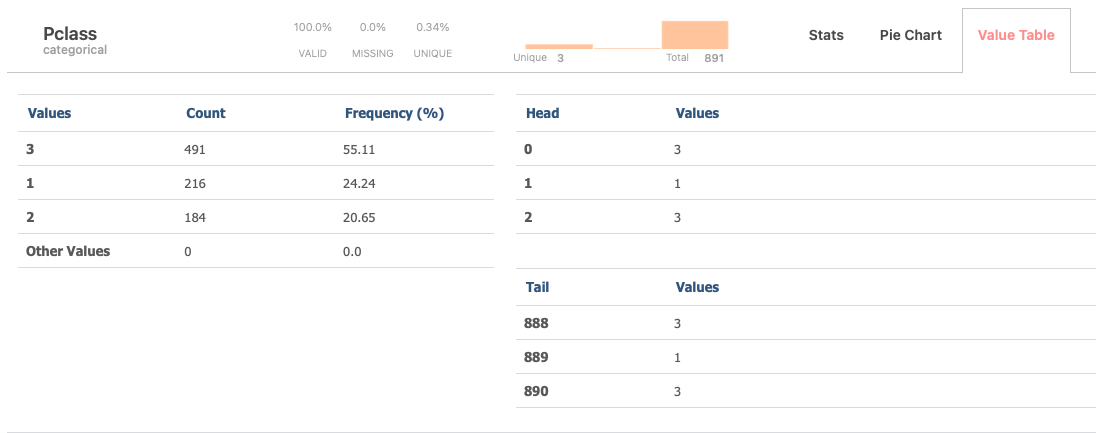
The value table organizes data by sorting values according to their frequency of occurrence, enabling quick identification of the most common values (up to 10) within the dataset.
And additionaly displaying the top three and bottom three values for quick reference and analysis.