Missing

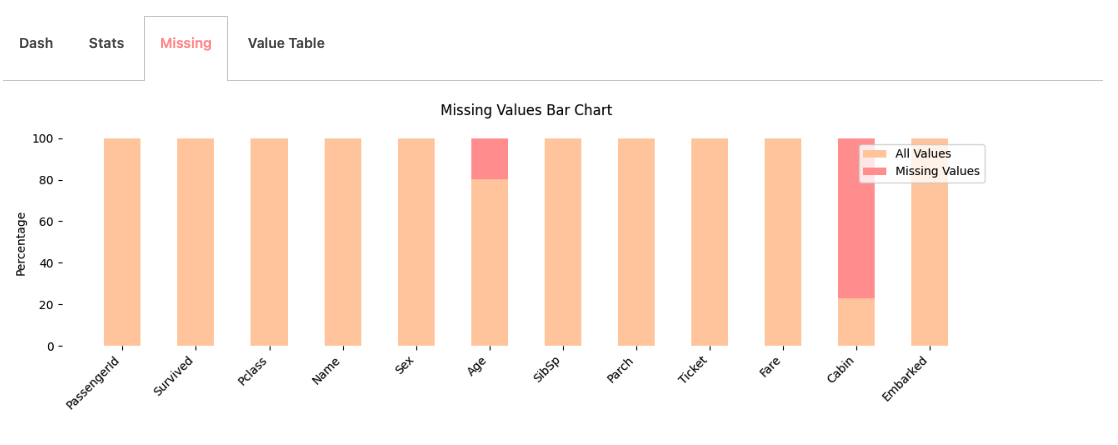
A highly intuitive bar chart presenting the distribution of missing values across the dataset, expressed as percentages for enhanced clarity and insight.
dashboard

A highly intuitive bar chart presenting the distribution of missing values across the dataset, expressed as percentages for enhanced clarity and insight.