Dash
The dashboard at the top serves as a dynamic hub, offering a snapshot of critical insights derived from the dataframe. With its intuitive layout, it provides at-a-glance access to key metrics, trends, and patterns, empowering users to make informed decisions swiftly.
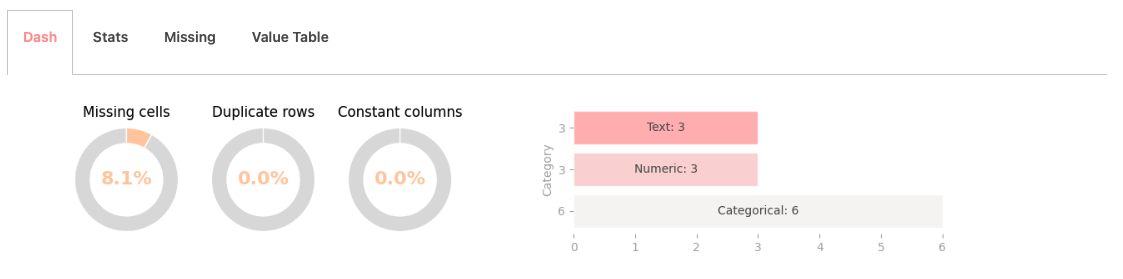
The layout is highly intuitive; the donut charts represent missing, duplicate, and constant values as percentages, providing a clear understanding of their prevalence.
Meanwhile, the horizontal bar chart illustrates the count of specific variables, offering a tangible sense of their frequency within the dataset.