Adix provides you with these visualizations to help you with your analysis
Violin Plot
ix.eda(titanic,'Age','Survived')
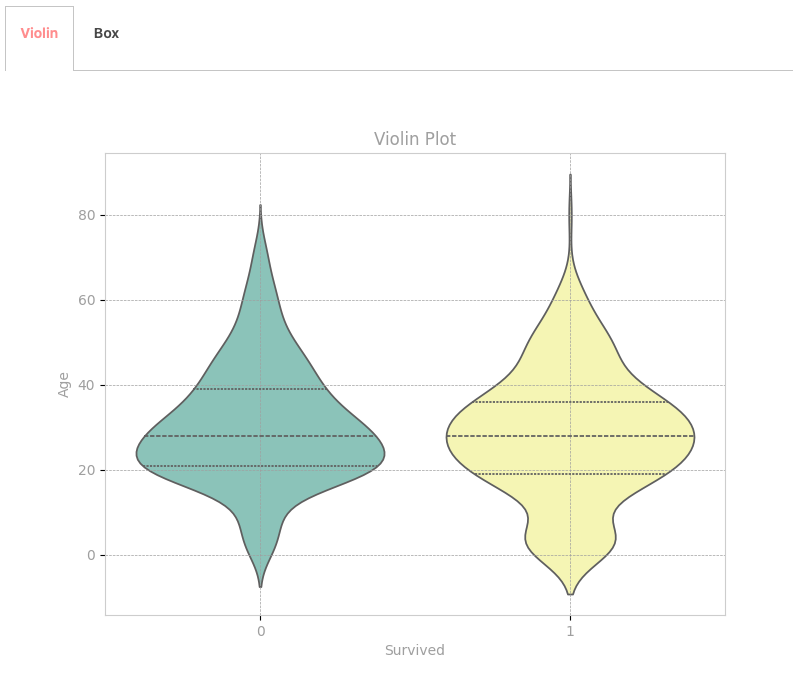
Violin plots offer a visual representation of the distribution of a continuous variable across different categories of a categorical variable. Similar to box plots, violin plots display the median, quartiles, and outliers, while also depicting the kernel density estimation of the data.
This provides a more detailed view of the distribution shape within each category. With Adix, explore the relationships between categorical and continuous variables effectively using the Violin Plot feature.
Box Plot
ix.eda(titanic,'Age','Survived')
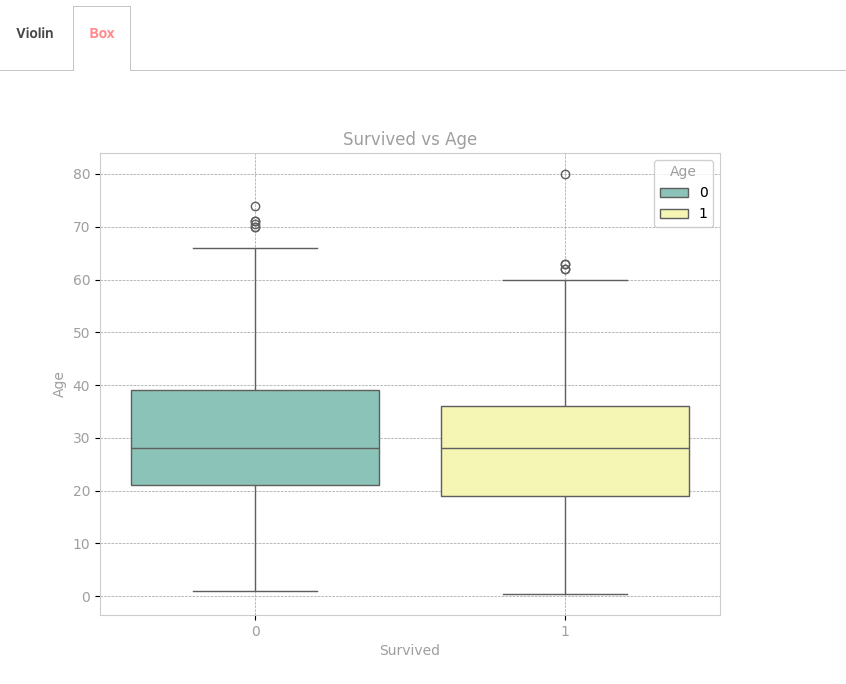
Box plots summarize the distribution of a continuous variable across categories of a categorical variable. They display the median, quartiles, and outliers, providing insights into variations across categories. With Adix, analyze your data efficiently and gain insights into categorical and continuous variable relationships using the Box Plot feature.