Published: Feb 9, 2024 by imooger
Welcome to the world of automatic data analytics with adix a Jupyter notebook package for data analytics, designed to streamline the process of exploring and understanding your datasets!
In this tutorial, we’ll explore how to quickly analyze and visualize your data using this powerful tool. With just one function ix.eda.(), your entire dataset becomes an open book. Hold on tight as we uncover hidden insights and embark on an adventure of discovery!
Quick Start
Let’s dive right in and see how adix can simplify your data analysis workflow.
Installation
To get started with adix, you can easily install it using pip:
pip install adix
Please note that adix is still under active development. If you encounter any issues during installation or while using the tool, don’t hesitate to reach out for support.
Loading Data
First, in Jupyter notebook, let’s load a dataset to work with. adix provides convenient functions to load sample datasets for demonstration purposes. For example:
import adix as ix
from adix.datasets import load_dataset

# Load the Titanic dataset
titanic = load_dataset('titanic')
1. Rendering the Entire DataFrame
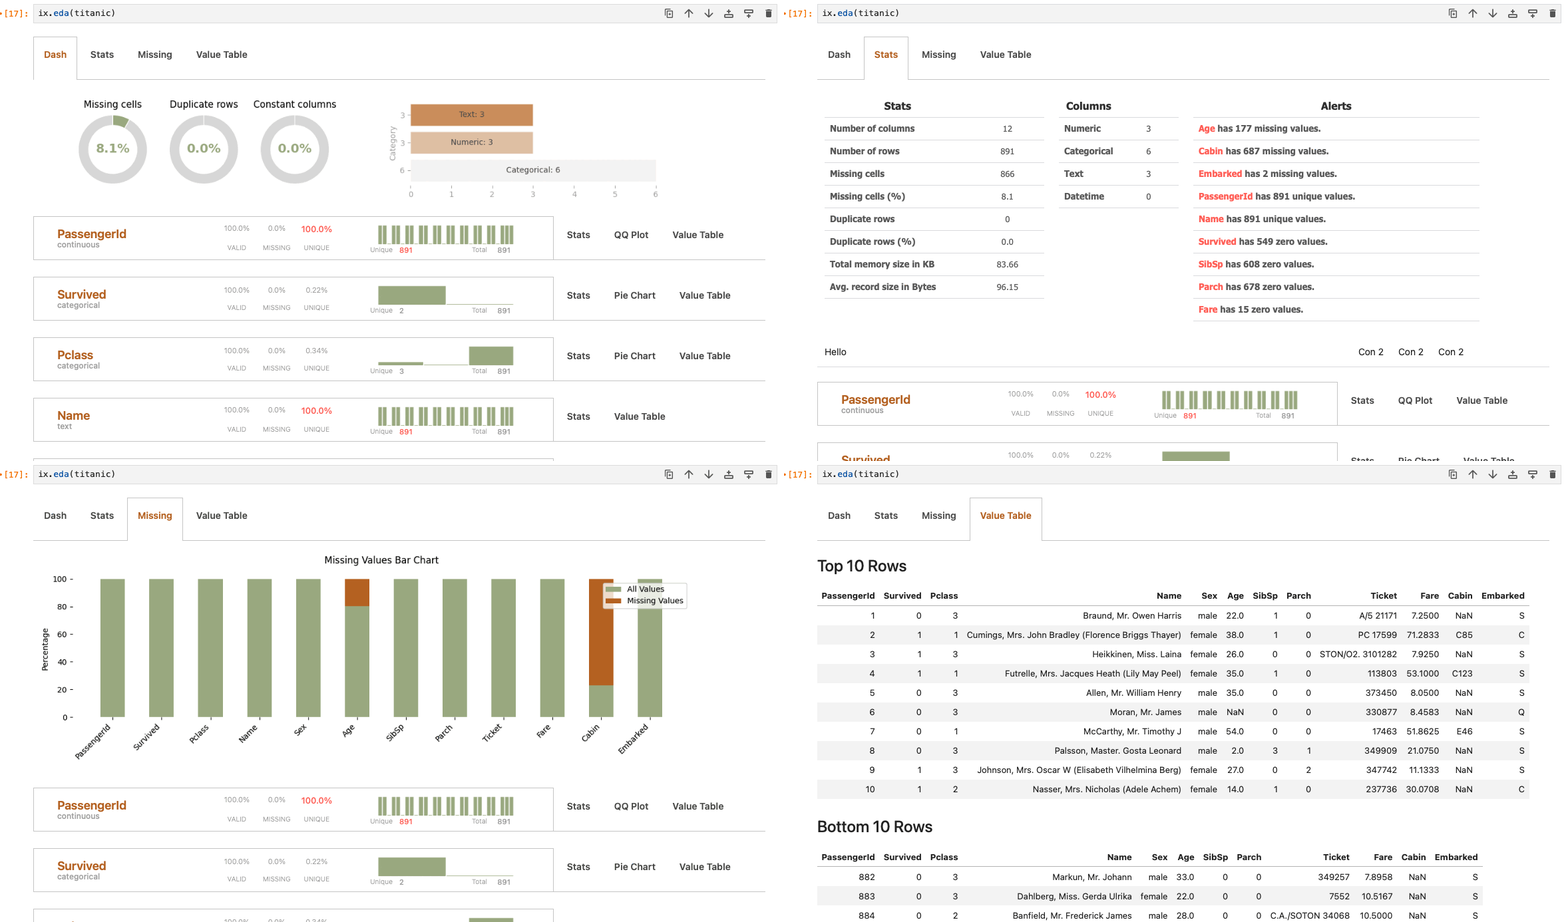
With adix, visualizing the entire dataset is as simple as calling a single function:
ix.eda(titanic)
This will generate a comprehensive overview of the dataset, allowing you to quickly grasp its characteristics.
2. Accessing Variables of Specific Data Types
You can focus your analysis on variables of a specific data type. For instance, to visualize only categorical variables, adix automatically detects data types. Additionally, you can also explicitly set variable data types; refer to the documentation for more details:
ix.eda(titanic, val='categorical')
3. Accessing Individual Variables
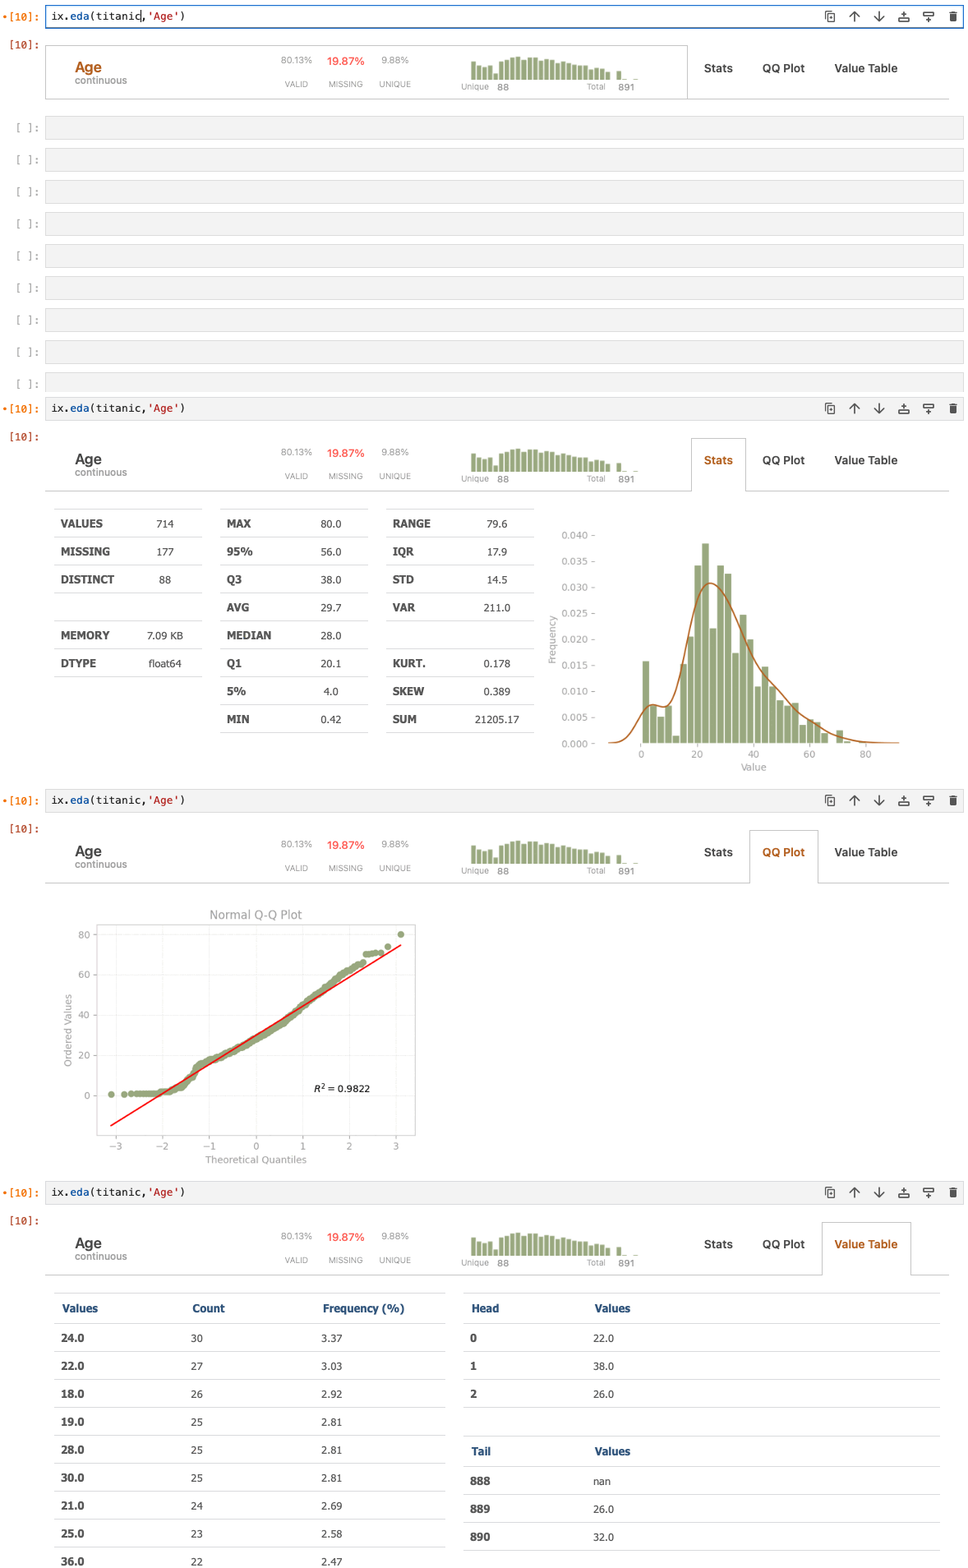
You can inspect a wide variety of different data types, each with its own set of statistics. To delve deeper into a specific variable, such as ‘Age’, you can use:
ix.eda(titanic, 'Age')
4. Pandas .loc & .iloc & .query()
Since adix accepts a pandas dataframe as the initial input, you can leverage familiar pandas functionalities like .loc and .iloc to analyze specific portions of the dataset, or you can utilize .query() for concise and efficient data filtering based on boolean expressions, enhancing the flexibility and ease of data analysis.
ix.eda(titanic.loc[:10:2,['Age','Pclass','Fare']])
5. Changing Theme Colors
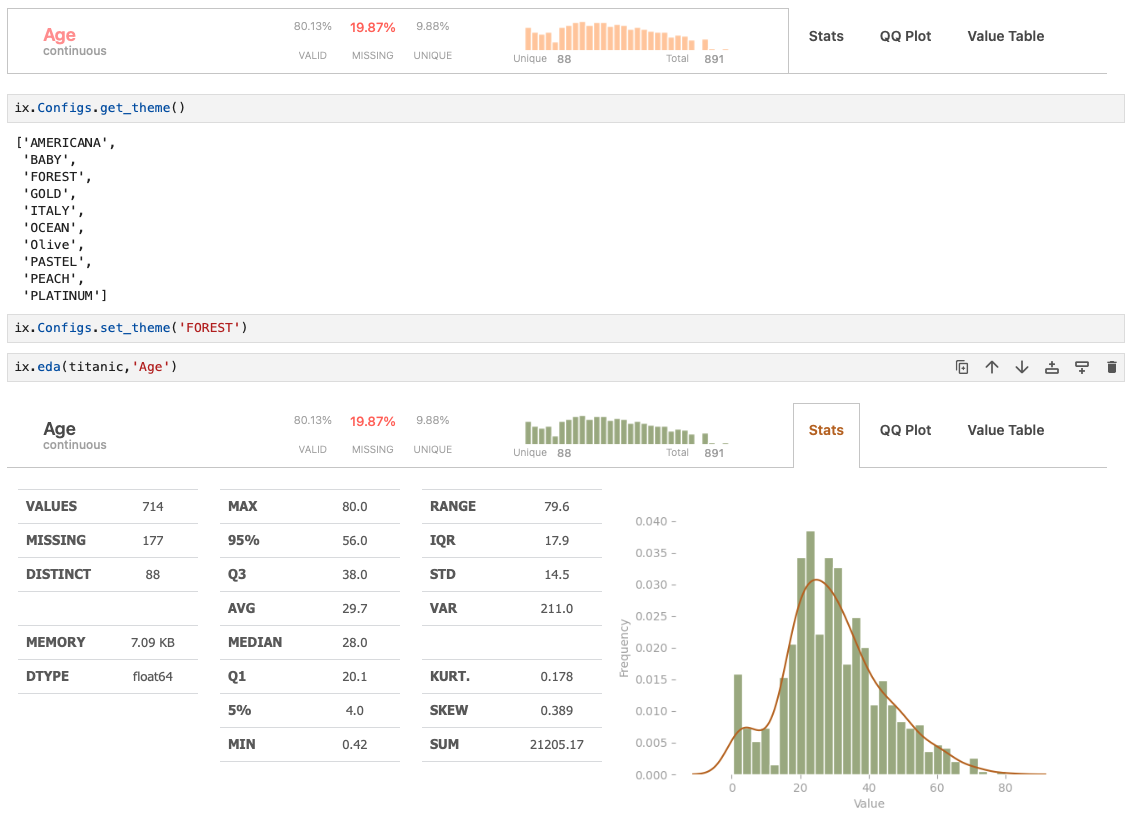
Customize the visualization theme to suit your preferences. For customizing adix with your own color palettes, refer to the documentation:
ix.Configs.get_theme()
# Explore available themes and set your preferred one
ix.Configs.set_theme('FOREST')
6. Exploring Bivariate Relationships: Numerical & Numerical
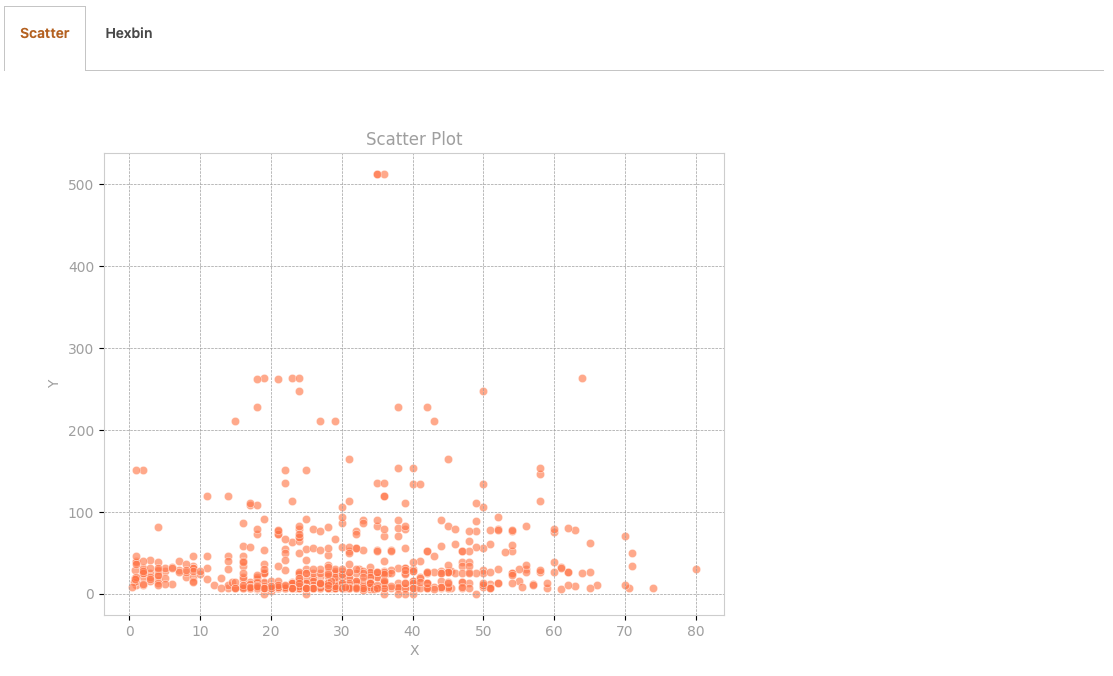
Visualize relationships between numerical variables like ‘Age’ and ‘Fare’:
ix.eda(titanic, 'Age', 'Fare')
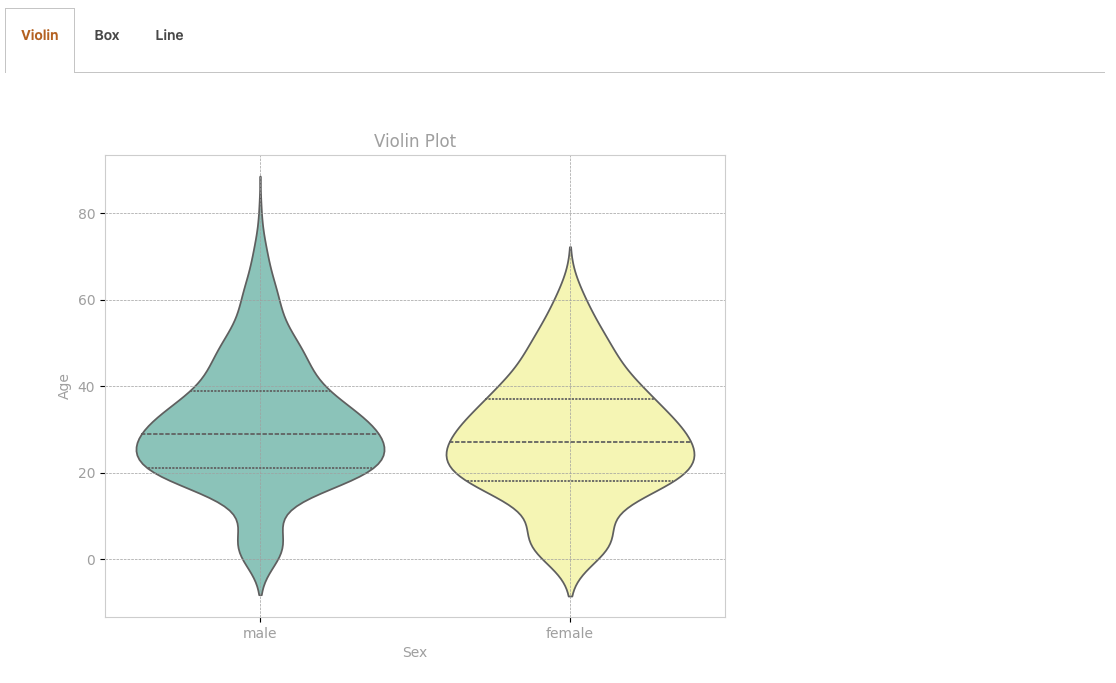
7. Exploring Bivariate Relationships: Categorical & Numerical
Investigate the relationship between categorical and numerical variables, such as ‘Sex’ and ‘Age’:
ix.eda(titanic, 'Sex', 'Age')
8. Exploring Bivariate Relationships: Categorical & Categorical
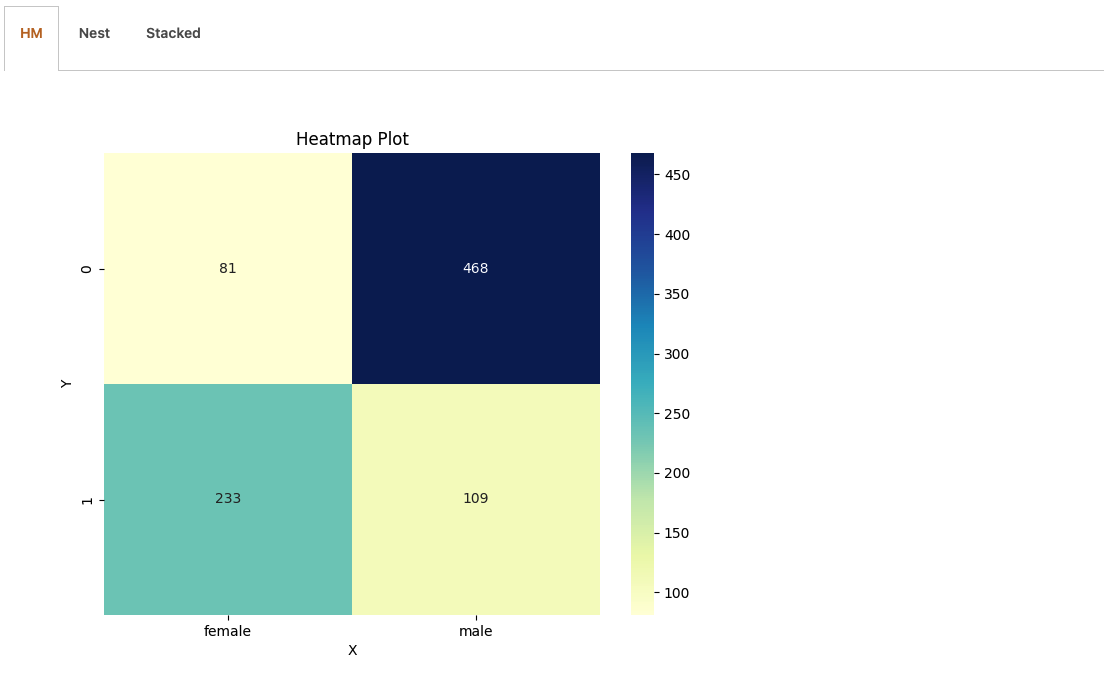
Finally, analyze relationships between categorical variables, like ‘Sex’ and ‘Survived’:
ix.eda(titanic, 'Sex', 'Survived')
With adix, you have the power to perform comprehensive data analysis effortlessly, from exploring basic statistics to uncovering intricate relationships within your datasets. Start leveraging the capabilities of adix today to unlock deeper insights from your data!


